
Data Analyst Werkstudent
XP (X-ray production) and D&A (Digital & Automation Team)
Company:
Siemens Healthineers
Location:
Erlangen, Germany
Year:
04/2023 - Current

Overview
I’ve been working at Siemens Healthineers for over 2.5 years, where I’ve grown from building data pipelines to creating tools that make complex healthcare systems raw data easier to understand.
My journey began in the X-ray Production (XP) team, where I focused on transforming raw technical data into something structured and meaningful. Later, I joined the Digital & Automation (D&A) team, contributing to data architecture and visualization for the Teamplay Data Lake.
My Role
XP (X-ray Production) Team
Pipeline Overview:
Designed a modular data pipeline connecting configuration, workflow, and acquisition data stages.
Built automated extraction and transformation modules in Azure Databricks using Python (pandas, PySpark) and SQL.
Implemented schema-based modeling (similar to a Snowflake schema) to connect multi-stage manufacturing data.
Developed validation layers for data completeness, timestamp alignment, and consistency across workflow stages.
Created monitoring scripts to ensure reliability and fast recovery from failed pipeline executions.
Key Achievements:
Reduced manual data preparation time by ~70%.
Enabled continuous data flow and real-time insight generation for process analytics.
Improved overall data reliability through automated validation and timestamp-based joins.
Data model representation connecting system configurations, workflows, and acquisition data for structured analytics.
D&A – Teamplay Data Lake
Built an end-to-end cost analytics dashboard connecting MR, XP, and XMart services.
Queried and preprocessed datasets using Azure DevOps KQL (Kusto Query Language).
Implemented structured ETL workflows in Azure for data consistency.
Implemented Snowflake schema for analytical flexibility.
Designed data models and star schemas linking key cost drivers.
Developed Power BI dashboards for real-time tracking of resource usage and cost trends.
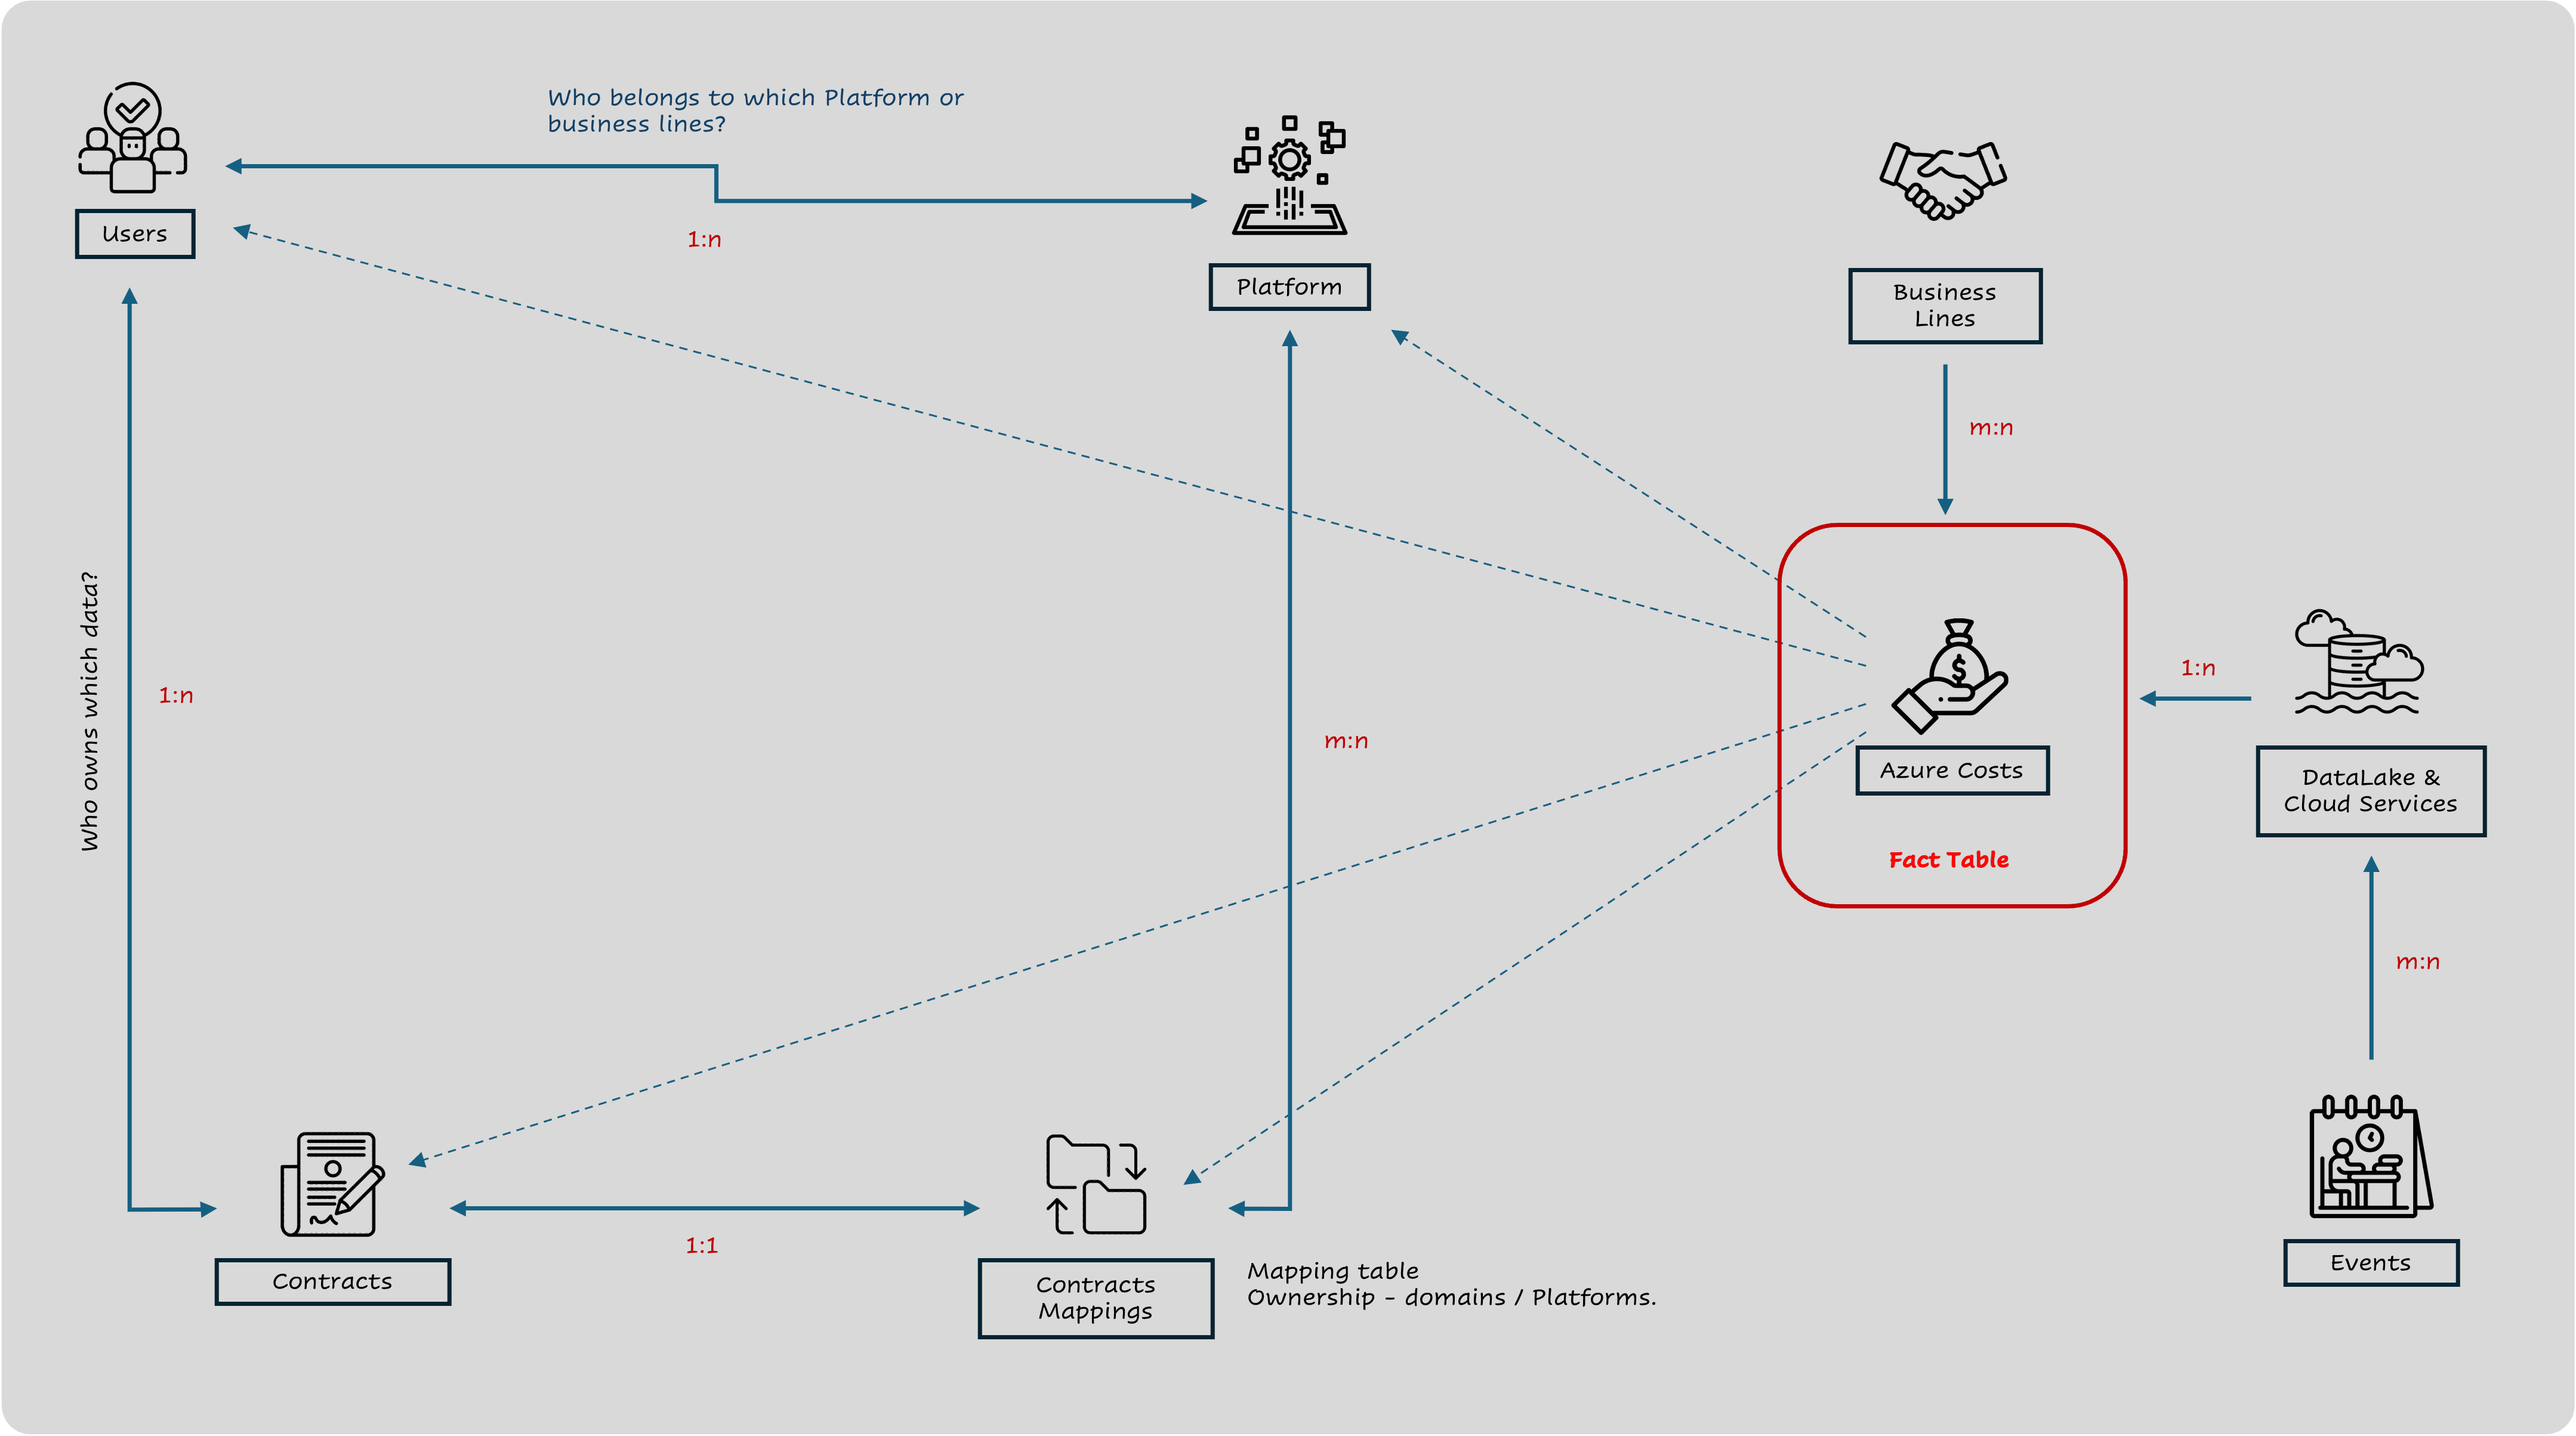
Designed and deployed a cloud-integrated data model in Azure linking datasets across multiple imaging modalities (MR, XP, XMart).
Built ETL workflows using Azure Data Factory and KQL (Kusto Query Language) for automated data ingestion and cleaning.
Defined star and bridge schemas to map platform usage, ownership, and cost attributes.
Developed Power BI dashboards visualizing real-time cloud service costs, user activities, and resource utilization.
Key Features:
Fully automated cost-tracking and monitoring workflows.
Scalable data schema supporting multiple platforms and services.
Integration with Azure DevOps and Databricks for versioned data processing.
Improved transparency in cost and service usage across global teams.
Outcome:
Delivered a unified analytics layer bridging technical and financial data.
Reduced manual reporting efforts by 80%.
Enhanced cross-team visibility into Azure resource performance and utilization.
Key Features
End-to-end data pipelines and automated ETL workflows.
Schema-based modeling for structured, scalable analysis.
Cloud integration with Azure, Databricks, and DevOps.
Power BI dashboards with real-time cost and usage metrics.
Data validation, error handling, and quality control.
Optimized performance for large-scale data processing.
Reusable code modules and automation scripts.
Improved visibility and faster decision-making across teams.
Skills Demonstrated
Data Pipeline Design: ETL/ELT workflows, modular architecture, pipeline monitoring
Data Modeling: Snowflake/star schema design, relational modeling for analytics
Cloud Platforms: Azure Databricks, Azure Data Factory, DevOps, Data Lake
Programming: Python (pandas, PySpark), SQL, dbt-style transformations
Visualization: Power BI, Tableau
Data Quality: Validation, consistency checks, performance monitoring